Usage
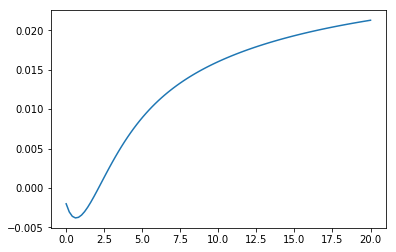
To instantiate and evaluate a Nelson-Siegel-Svensson-Curve simply import the curve class, call the constructor with the desired parameters and then call the resulting curve instance with a numpy array of time points:
from nelson_siegel_svensson import NelsonSiegelSvenssonCurve
import numpy as np
from matplotlib.pyplot import plot

y = NelsonSiegelSvenssonCurve(0.028, -0.03, -0.04, -0.015, 1.1, 4.0)
t = np.linspace(0, 20, 100)
plot(t, y(t))
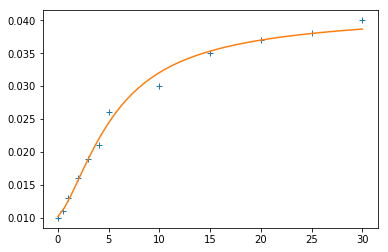
In order to calibrate a curve to given data you can use the calibrate_ns_ols and calibrate_nss_ols functions in the calibrate module:
import numpy as np
from nelson_siegel_svensson.calibrate import calibrate_ns_ols

t = np.array([0.0, 0.5, 1.0, 2.0, 3.0, 4.0, 5.0, 10.0, 15.0, 20.0, 25.0, 30.0])
y = np.array([0.01, 0.011, 0.013, 0.016, 0.019, 0.021, 0.026, 0.03, 0.035, 0.037, 0.038, 0.04])

curve, status = calibrate_ns_ols(t, y, tau0=1.0)  # starting value of 1.0 for the optimization of tau
assert status.success
print(curve)
which gives the following output:
NelsonSiegelCurve(beta0=0.04201739383636799, beta1=-0.031829031569430594, beta2=-0.026797319779108236, tau=1.7170972656534174)